•Dollar weakens on disappointing housing data. US new home sales declined in September, suggesting a segment of the housing market could be cooling down. However, the moderation in new home sales is in contrast with other housing data, as existing home sales, housing starts and building permits for the same month showed signs of a recovery. As a result, the September report does little to change our view that overall the housing market is improving. Despite the soft data, the weakness in dollar could be also attributed to some profit-taking ahead of the FOMC meeting on Wednesday, especially following the recent rally of USD.
• Overnight New Zealand’s trade deficit widened unexpectedly in September as dairy exports declined, dragging down the country’s exports, while imports remained strong across a range of categories. As a result, New Zealand recorded a trade deficit of above 1bn for the second consecutive month in September. The recent rebound in global dairy prices won’t be captured in the trade figures until November. NZD/USD fell sharply following the release, but recovered immediately to continue to drift around 0.6780, as we write. Investors have adopted a cautious stance against kiwi ahead of the Reserve Bank of New Zealand (RBNZ) policy meeting, amid speculation that the Bank will remain on hold at this meeting. Yet, an unexpected rate cut or a dovish tone from Gov. Wheeler could put NZD under renewed selling pressure.
• Today’s highlights: The highlight of the day will be the preliminary UK GDP for Q3. The forecast is for the growth to have slowed to +0.6% qoq from +0.7% qoq. However, given the strong industrial production for August and the much-better-than expected retail sales for September, we see the likelihood for a positive surprise rather than a slowdown.
• In Eurozone, the M3 money supply is forecast to have accelerated to 5.0% yoy in September, from 4.8% in August. The 3-month moving average is expected to accelerate a bit if the forecast is met. Private sector loan growth increased in August and the latest ECB lending survey showed further pick-up in loan demand. As a result, loans to the private sector are also forecast to have accelerated modestly.
• However, these data are not major market affecting and therefore, the reaction in the market could be limited.
• From the US, we get durable goods orders for September. The headline figure is expected to fall for a second consecutive month, while durable goods excluding transportation equipment are estimated to have remained unchanged after falling somewhat in August. The focus is usually on the core figure, where a positive surprise could suggest a possible turnaround in business investment and could support the dollar. The preliminary Markit service-sector PMI for October is forecast to have remained unchanged at 55.1, while the Conference Board consumer confidence index for the same month is forecast to have declined fractionally. The SnP/Case-Shiller house price index for August is also coming out.
• We have no speakers on Tuesday’s agenda.
The Market
EUR/USD corrects higher
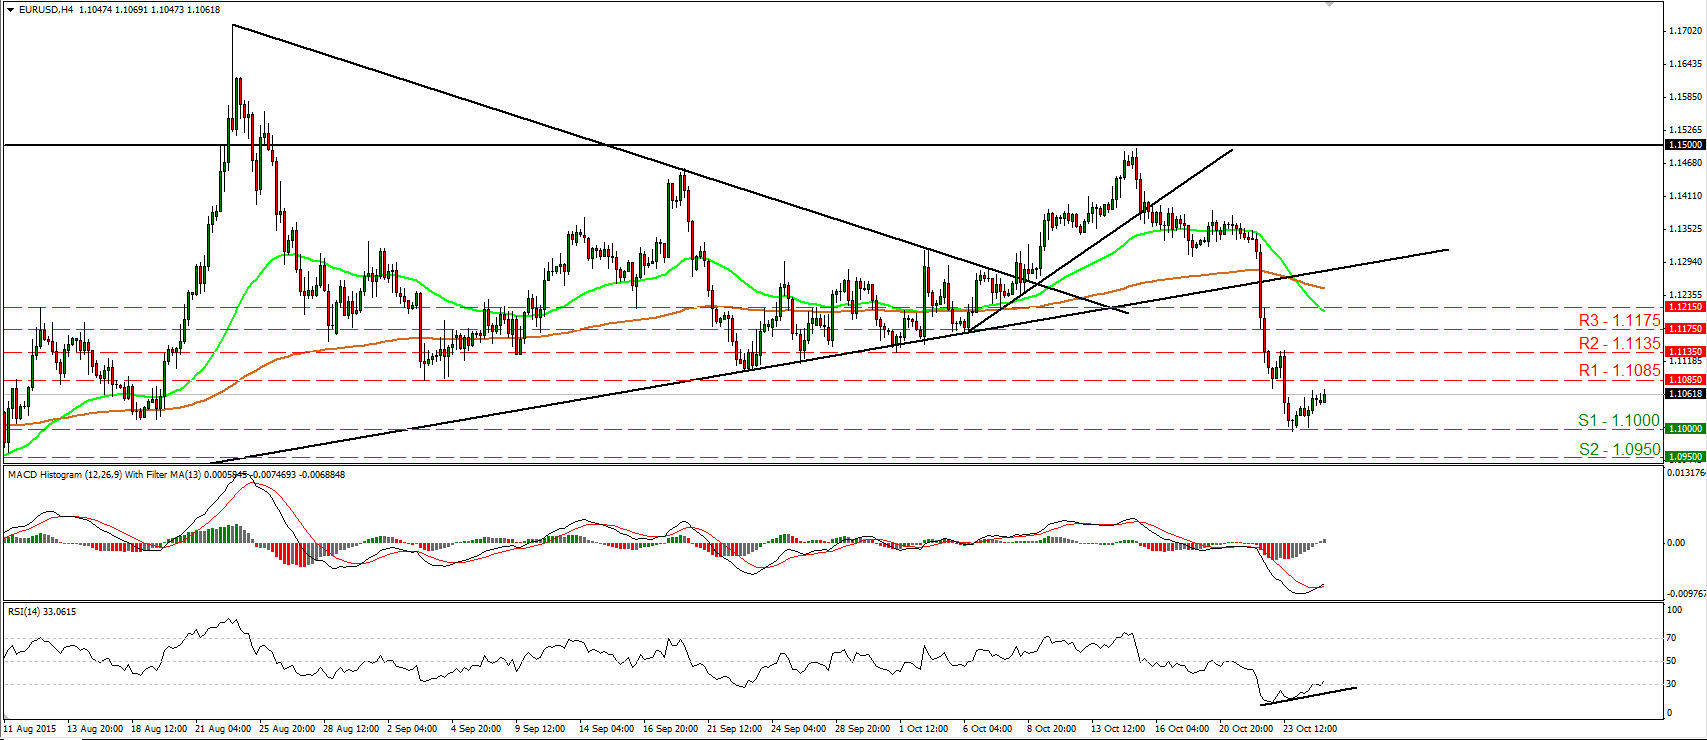
• EUR/USD traded higher on Monday and during the early European morning Tuesday, it is approaching the 1.1085 (R1) resistance line. The price structure on the 4-hour chart still suggests a short-term downtrend. Nevertheless, I see signs that the recent corrective rebound may continue a bit more. A clear move above 1.1085 (R1) is likely to confirm further correction and could aim for the next resistance at 1.1135 (R2). Our short-term oscillators support the notion as well. The RSI exited its below-30 territory and is pointing up, while the MACD has bottomed and crossed above its trigger line. Furthermore, there is still positive divergence between the RSI and the price action. In the bigger picture, as long as EUR/USD is trading between the 1.0800 key support and the psychological zone of 1.1500, I would maintain my neutral stance as far as the overall picture is concerned. I would like to see a clear break below the 1.0800 hurdle before assuming that the longer-term trend is back to the downside. On the upside, another move above 1.1500 is needed to turn the overall outlook positive.
• Support: 1.1000 (S1), 1.0950 (S2), 1.0860 (S3)
• Resistance: 1.1085 (R1), 1.1135 (R2), 1.1175 (R3)
GBP/USD rebounds from 1.5300
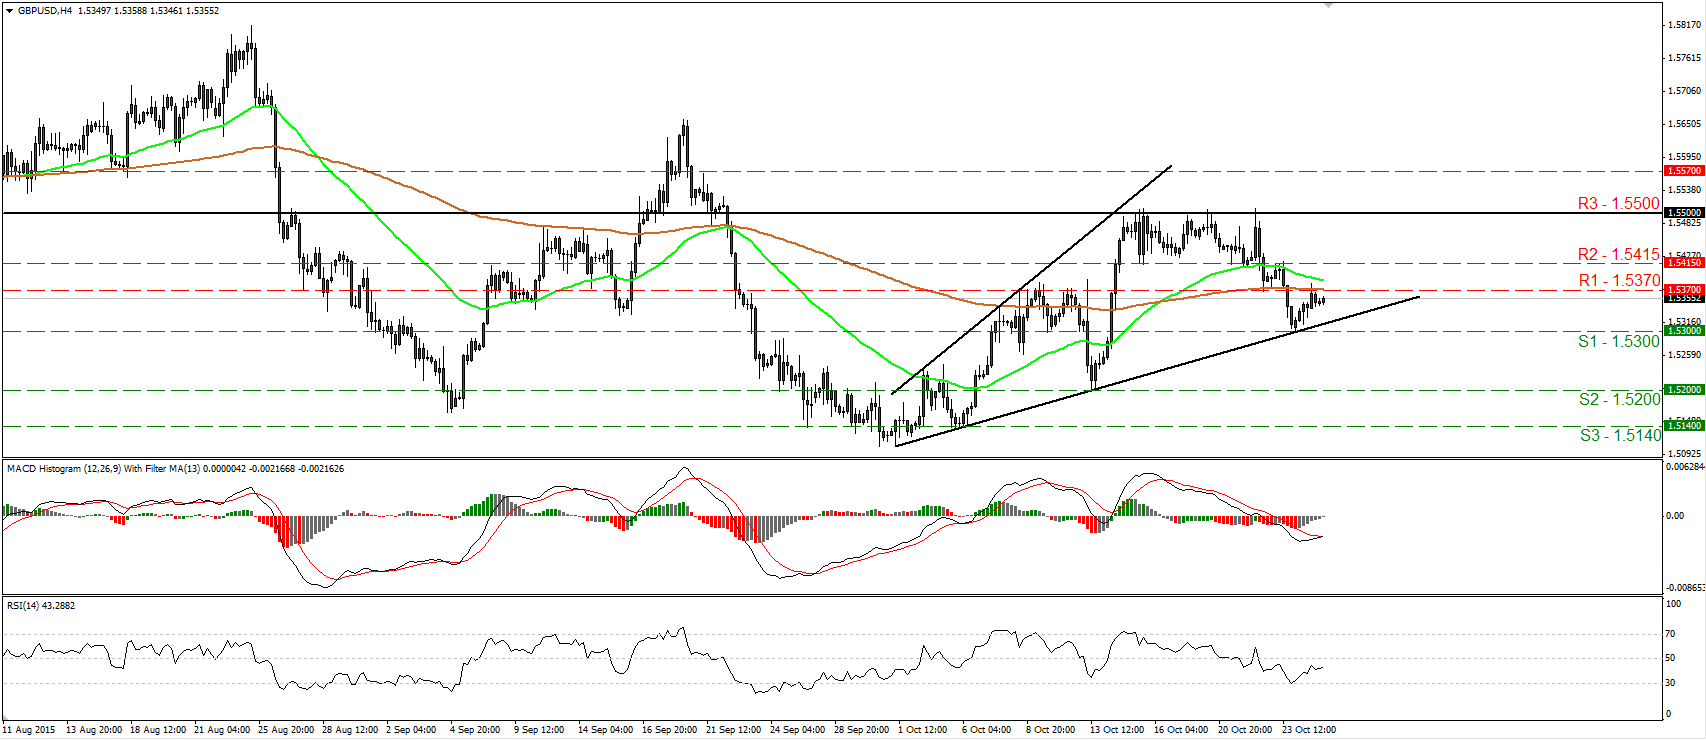
• GBP/USD rebounded on Monday after it hit support near the 1.5300 (S1) support hurdle and the upside support line taken from the low of the 1st of October. Subsequently, the rate hit resistance near the 1.5370 (R1) obstacle. A decisive move above 1.5370 (R1) is likely to signal the continuation of the positive move and could aim for the next resistance at 1.5415 (R2). Today we get the preliminary UK GDP for Q3 and a positive surprise could be the catalyst for such a move. Our short-term oscillators favor further bullish extensions as well. The RSI rebounded from its 30 line and is now approaching its 50 line, while the MACD has bottomed and just poked its nose above its trigger line. On the daily chart, the rate oscillates above and below the 80-day exponential moving average. Having that in mind, and that there is no clear trending structure, I would still hold a “wait and see” stance as far as the overall outlook of the pair is concerned.
• Support: 1.5300 (S1), 1.5200 (S2), 1.5140 (S3)
• Resistance: 1.5370 (R1), 1.5415 (R2), 1.5500 (R3)
AUD/USD finds resistance at 0.7265
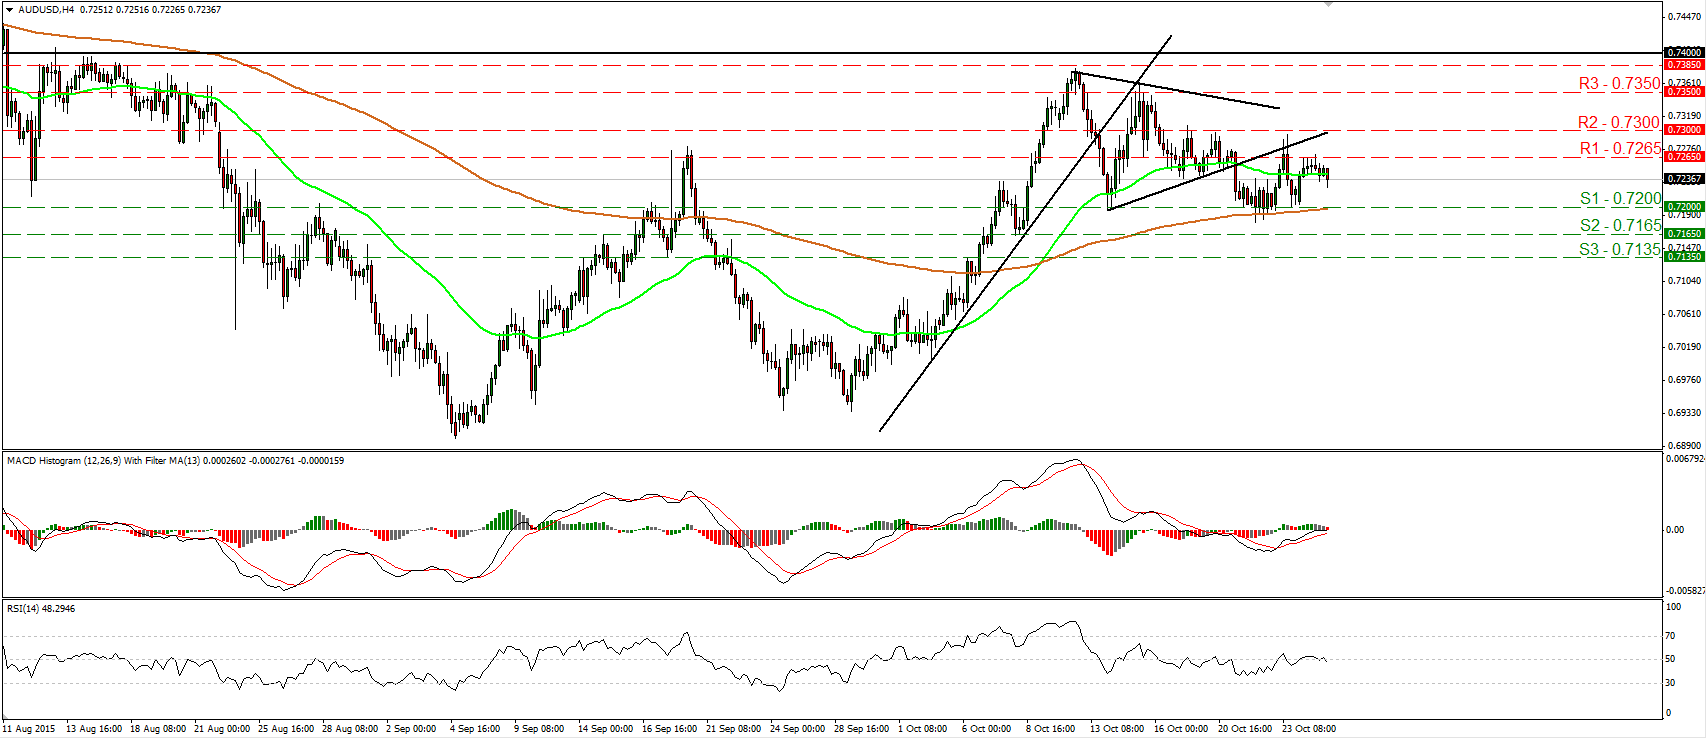
• AUD/USD hit resistance at 0.7265 (R1) yesterday and today during the Asian morning, it turned down. I would now expect the forthcoming wave to be negative and perhaps challenge once again the 0.7200 (S1) barrier. Nevertheless, a break below 0.7200 (S1) is needed to signal a forthcoming lower low on the 4-hour chart and turn the short-term picture negative. Something like that could prompt extensions towards our next support of 0.7165 (S2), defined by the low of the 8th of October. Our short-term momentum studies detect negative momentum and amplify the case for a negative move, at least towards 0.7200 (S1). The RSI has turned down and fell back below its 50 line, while the MACD shows signs of topping marginally below its zero line. As for the broader trend, the completion of a failure swing bottom on the 9th of October has turned the medium-term outlook somewhat positive. Nevertheless, given the recent sideways action, and the break below the lower bound of the triangle that had been containing the price action from the 12th until the 21st of October, I would hold a flat stance for now as far as the longer-term picture is concerned.
• Support: 0.7200 (S1), 0.7165 (S2), 0.7135 (S3)
• Resistance: 0.7265 (R1), 0.7300 (R2), 0.7350 (R3)
DAX hits resistance slightly below 10880
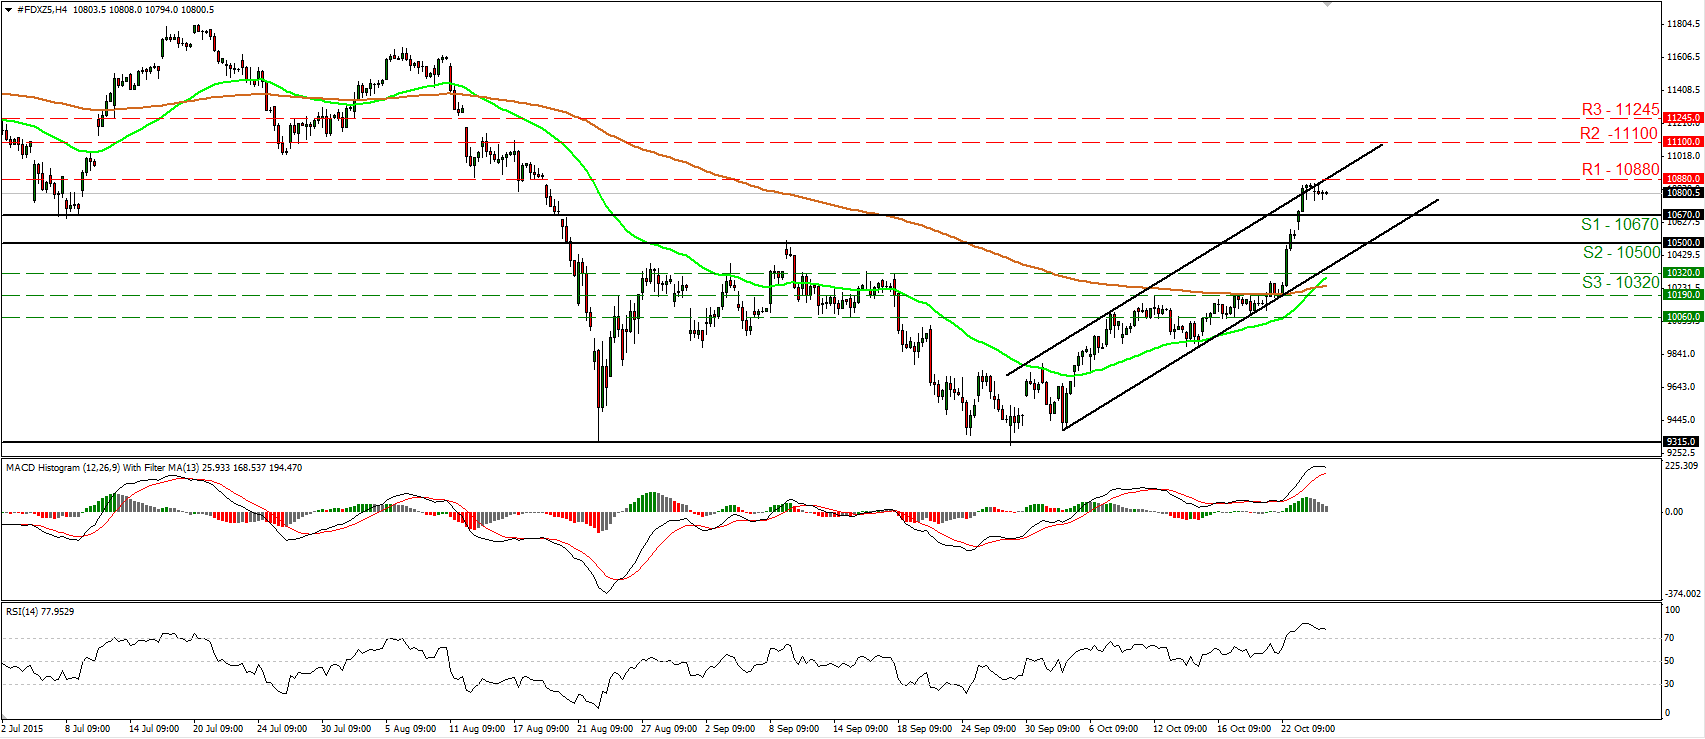
• DAX futures moved sideways yesterday, staying marginally below the resistance hurdle of 10880 (R1). As long as the index is trading within a short-term upside channel, I would consider the near-term path to be positive. A clear move above 10880 (R1) is likely to set the stage for extensions towards our next obstacle at 11100 (R2). However, our short-term oscillators provide evidence that a corrective setback could be in the works before buyers decide to take the reins again. The RSI has topped within its above-70 territory, while the MACD has topped as well and could fall below its trigger line soon. On the daily chart, the break above the psychological zone of 10500 (S2) signaled the completion of a possible double bottom formation. Moreover, buyers managed to overcome the key obstacle of 10670 (S1). These technical signs support that we are likely to see the index trading higher in the foreseeable future.
• Support: 10670 (S1), 10500 (S2), 10320 (S3)
• Resistance: 10880 (R1), 11100 (R2), 11245 (R3)
Gold trades quietly
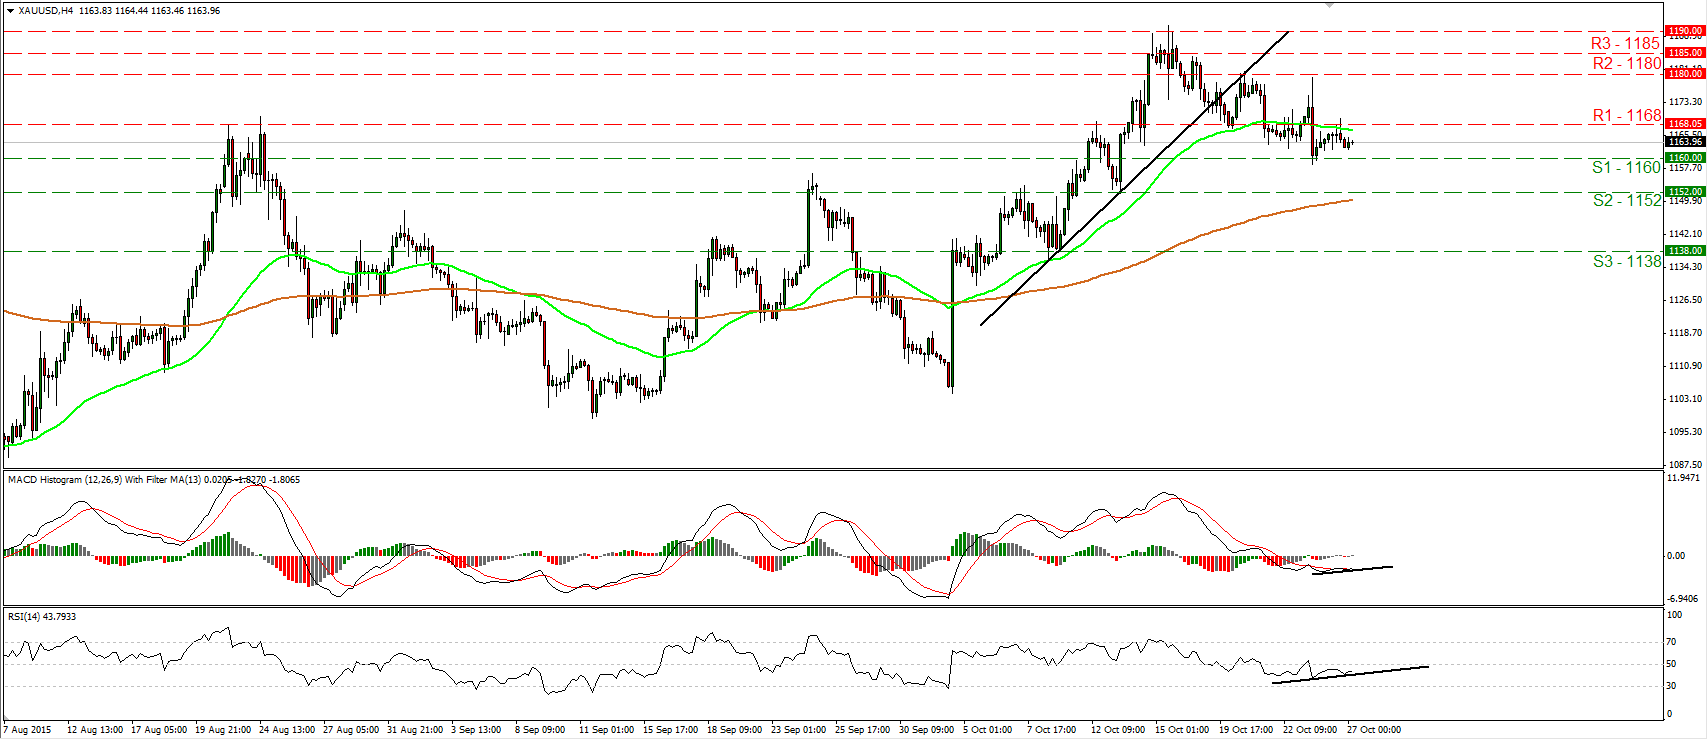
• Gold traded in a quiet mode yesterday, staying between the support of 1160 (S1) and the resistance of 1168 (R1). Even though the price structure still suggests a short-term downtrend, I still see the likelihood for an upside corrective move. A clear move above 1168 (R1) could reaffirm the case and perhaps open the way for another test around the 1180 (R2) territory. Our short-term oscillators support further rebound as well. The RSI has turned up again, while the MACD has bottomed and crossed above its trigger line. On the daily chart, the longer-term outlook remains somewhat positive. As a result, I would consider the retreat started on the 15th of October as a corrective phase, at least for now.
• Support: 1160 (S1), 1152 (S2), 1138 (S3)
• Resistance: 1168 (R1), 1180 (R2), 1185 (R3)

